Thus far, we have looked at equations that are well suited for illustrating the theory and concept of prestressing. The remainder of this chapter will deal with more practical concerns and design examples.
To visualize the idea of friction loss, imagine if at midspan, there was so much friction in the duct, that the latter half of the span had no prestressing force whatsoever, as shown below.
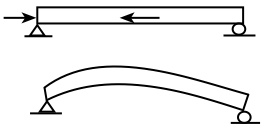
This is essentially what can happen in a beam, if the geometry of the duct is curved, or if the duct material has a high friction coefficient, or other factors as well, which will be discussed in more detail later. It is possible to measure friction loss in the field, as follows:


For the sake of clarity, we can take  as a known value, as read from the hydraulic jack.
  and
and  are known as well.
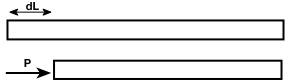
We can measure  , say with a tape measure, and then solve for
  from the above equation. If the duct were frictionless, then would equal the full length of the beam. In reality, would turn out to be less than the full length.
In practice, the precise measurement of in the field should confirm the expected friction loss from theory ( 5%).
5%).
The theory behind friction loss in prestressed (post-tensioned) beams is well developed.
The friction loss consists of two components: curvature and wobble.
Curvature friction losses occur from the intended angle changes of the draped tendon, and is essentially equal to  ; the common formula for friction.
  varies between .05 and .50.
Wobble friction losses occur from unintended angle changes, which essentially depends on an empirical “wobble coefficient”  . In qualitative terms, depends on the rigidity and diameter of the duct, in addition to the coefficient of friction of the material. varies between .0001 and .002 per foot.
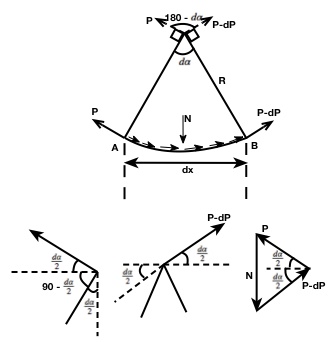
From equilibrium of the above force triangle,

Invoking small angle approximation, and 

 is the friction loss, and since we know that friction is , we can say that:

where the term  is associated with ‘wobble’


ACI Values
| Type of Tendon | Curvature Coefficient () |
Wobble Coefficient () per foot |
|---|---|---|
| Wire tendons | .15-.25 | .0010-.0015 |
| 7-wire strand | .15-.25 | .0005-.0020 |
| High-strength bars | .08-.30 | .0001-.0006 |
| Unbonded pre-greased tendons – wires or 7-wire strand | .05-.15 | .0003-.0020 |
| Unbonded mastic-coated tendons – wires or 7-wire strand | .05-.15 | .0010-.0020 |
CEB-FIP Values
| Type of Tendon | Curvature Coefficient () |
Wobble Coefficient () per foot |
|---|---|---|
| Drawn wires | 0.20 | 0.0006 |
| Strand | 0.20 | 0.0006 |
| Smooth rolled wires | 0.25 | 0.0008 |
| Deformed wire | 0.30 | 0.0009 |
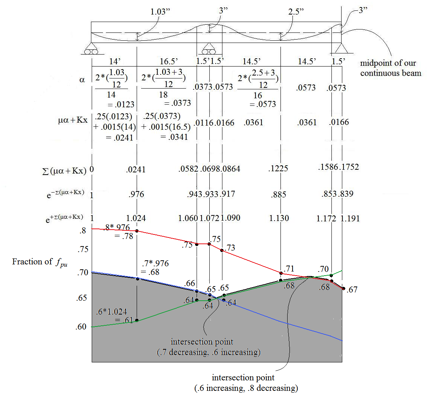
It is sufficiently accurate to calculate the tendon force only at the ends of each parabolic segment (for a draped tendon in a continuous beam) and then assume that the force varies linearly between these points.
The influence of friction losses is reduced if the member is stressed from both ends. Temporary overstressing of the tendon followed by release and subsequent re-stressing will also reduce friction losses.
During post-tensioning, it is usually permitted to stress the tendon temporarily to a maximum of about 80% of the specified tensile strength of the tendon. After anchoring, the stress in the tendon at anchorage is usually limited to 70%.

 expected tendon elongation
 average force in the tendon, determined from calculated force variation along the tendon
 total length of tendon (total length of beam is adequate)
The jacking system will result in additional losses due to the seating of the wedges which anchor the post-tensioning strands. This so-called ‘anchorage set’ is usually about .25 inches.
While friction creates somewhat of a hindrance during the jacking process, in some sense, friction mitigates the adverse effects of anchorage set: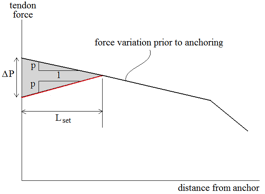
The anchorage set is proportional to the shaded area.
(1) 
where the numerator is the shaded area.
Since  extends from the initial and final values at the extreme end, rather than extending from the average values within
  , can be thought of as an overestimate of the tendon force loss.
Thus, the ratio  can be said to be an overestimate of the relaxation (shortening) of the tendon within the distance , due to anchor set. However, the shortening due to anchor set is in fact a known value, based on the type of jack used. We will solve for in the following way:
As the diagram shows,
(2) 

For the reasons previously stated, is actually underestimated. The implications of this are not immediately clear, since the approach for calculating , and more importantly,  , is trial and error, as will be seen in the following examples. It turns out that underestimating is aggressive, i.e. is underestimated as well. The error is small enough though that this is considered acceptable practice.
e.x. 1
A beam is stressed from both ends.
 ;
;  ;
;  ;
;  ;
; 
 , and the tendons are stressed to 75%
The table below shows the procedure for determining friction losses. The final solution, which includes additional losses due to anchor set, is presented in the table as well. The procedure for determining anchor set losses is presented after the table.
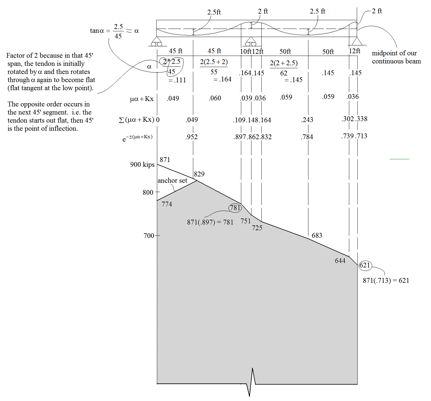
![\begin{align*} P_{AVE}(224') &= \text{average energy} \\ \hphantom{1} &= [\frac{1}{2}(871 + 829)*45 + \frac{1}{2}(829 + 781)*45 \\ &+ \frac{1}{2}(781 + 751)*10 + \frac{1}{2}(751+725)*12 \\ &+ \frac{1}{2}(725+683)*50 +\frac{1}{2}(683+644)*50 \\ &+\frac{1}{2}(644+621)*12] \end{align*}](https://utsv.net/wp-content/ql-cache/quicklatex.com-579bf281e95d069e80147637a1c53dab_l3.png "Rendered by QuickLaTeX.com")
where  is the total length of the beam pictured above (half the beam, since the beam is stressed symmetrical)

The expected elongation (remembering to convert to inches) is:

Note: anchor set is not included here, since this measurement would be made before the jack is removed
Anchor set: Trial one:
Within the first 45′, the tendon friction loss per inch is


 a second trial could be performed. However, the difference will be small, so
  will be used.

Thus, after anchoring, the force in the tendon is:

note: For a straight tendon, the tendon stress variation can easily be written as a function of the distance  . , as well as the tendon stress at the anchor, and the tendon stress at distance (i.e. the maximum tendon stress) can be found directly for a straight tendon. A trial and error approach is only required for tendons with varying curvature, since analysis of these tendons must use a table, as previously seen, with discreet distances along the length of the beam.
e.x. 2
A beam is jacked to 80%  , released to 60% , rejacked to 70% and then anchored.
The beam is stressed from both ends.
 ;
; 
Find: ratio throughout the tendon, ignoring anchor set